24% Decrease in China's Import of Vegetable Tanning Extracts to $2.9M in June 2023
China Vegetable Tanning Extracts Imports
In June 2023, the import of tanning extracts of vegetable origin, tannins and their salts, and other derivatives from abroad declined by -28.8% to 1.5K tons, marking the first decrease since March 2023 and ending a two-month rising trend. However, overall imports experienced a mild increase, with the most significant growth observed in May 2023 at 89% m-o-m. Consequently, imports reached a peak of 2.1K tons but dramatically declined in the following month.
In terms of value, the import of vegetable tanning extracts notably reduced to $2.9M in June 2023, according to IndexBox estimates. Despite the decline in June, imports saw a significant increase over the review period, with the most pronounced growth of 88% in May 2023 compared to the previous month. As a result, imports reached a peak of $3.8M before drastically reducing in the following month.
Imports by Country
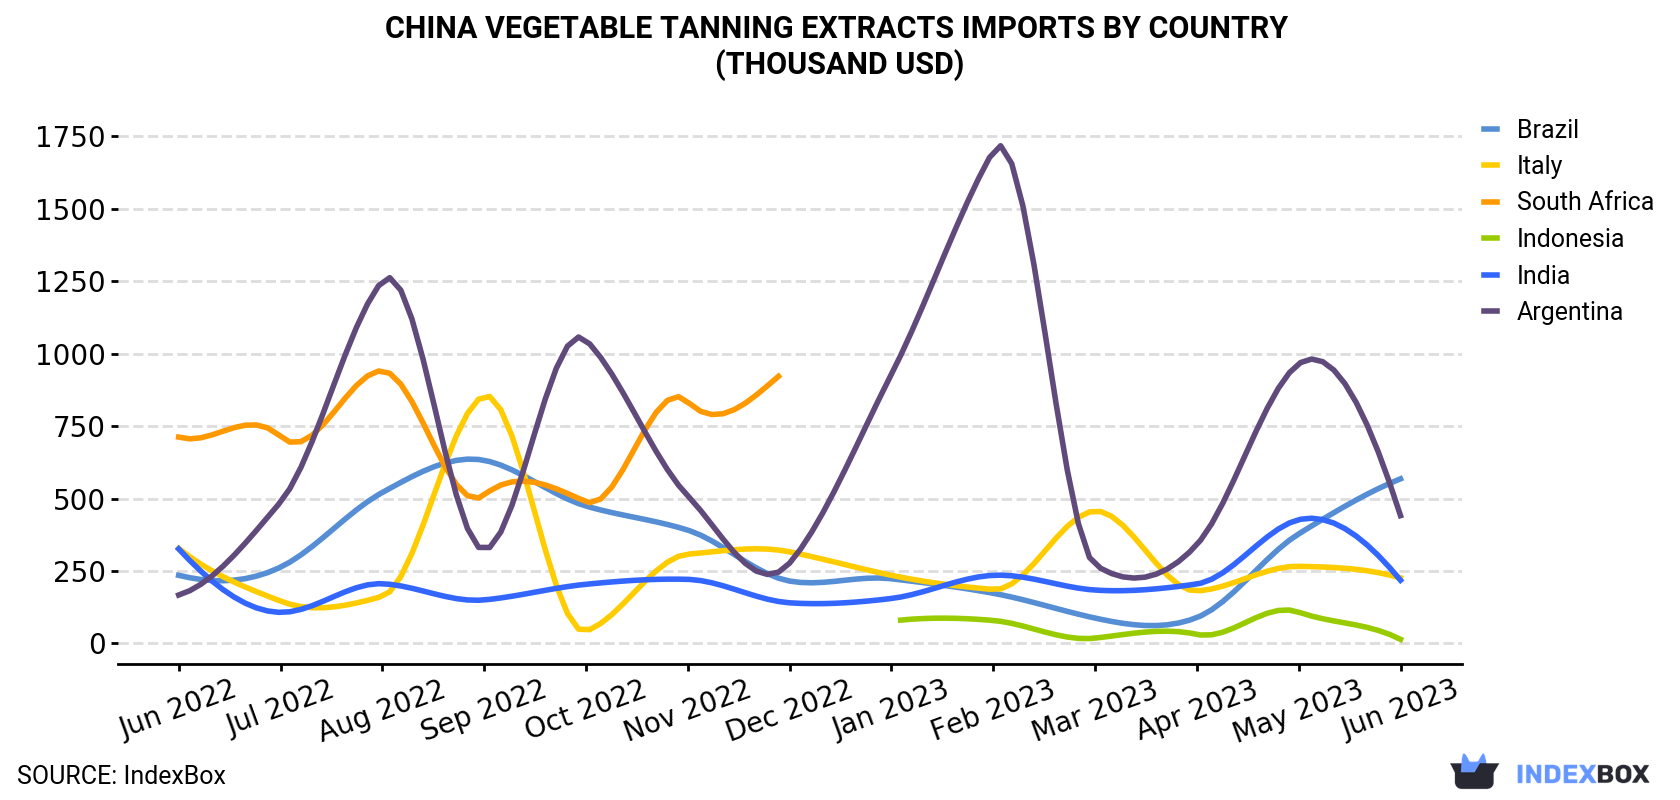
In June 2023, South Africa (714 tons) was the largest supplier of vegetable tanning extracts to China, accounting for a 47% share of total imports. The second-largest supplier, Brazil (278 tons), had threefold lower figures than South Africa. Argentina (210 tons) ranked third with a 14% share.
From June 2022 to June 2023, South Africa displayed an average monthly volume growth rate of +3.9%. The remaining supplying countries, Brazil and Argentina, had average monthly volume growth rates of +6.3% and +6.4% respectively.
In terms of value, South Africa ($1.3M) constituted 44% of total imports, followed by Brazil ($568K) with a 20% share, and Argentina with a 15% share.
From June 2022 to June 2023, South Africa had an average monthly value growth rate of +4.9%. Brazil and Argentina recorded average monthly value growth rates of +7.6% and +8.4% respectively.
Import Prices by Country
In June 2023, the price of vegetable tanning extracts reached $1,911 per ton (CIF, China), reflecting a 7.1% increase from the previous month. The average monthly price growth rate from June 2022 to June 2023 was +1.0%. The most rapid growth occurred in July 2022, with a 26% month-to-month increase, resulting in an import price peak of $2,136 per ton. From August 2022 to June 2023, the average import prices remained slightly lower.
Among the major supplying countries, Italy ($2,170 per ton) and Argentina ($2,102 per ton) had the highest prices, while India ($1,517 per ton) and South Africa ($1,780 per ton) had relatively lower prices.
From June 2022 to June 2023, India experienced the most notable price growth of +2.1%, while the other major suppliers had more modest price growth rates.
Source: IndexBox Market Intelligence Platform


Comments
Post a Comment